 | –≠–Ľ–Ķ–ļ—ā—Ä–ĺ–Ĺ–Ĺ—č–Ļ –ļ–ĺ–ľ–Ņ–ĺ–Ĺ–Ķ–Ĺ—ā: FLC10 | –°–ļ–į—á–į—ā—Ć:  PDF PDF  ZIP ZIP |

1/7
Application Specific Discretes
A.S.D.
TM
FLC10-200H
ģ
Jun 2000 - Ed: 5D
FIRE LIGHTER CIRCUIT
The FLC10 series have been developed espe-
cially for high power capacitance discharge opera-
tion. The main applications are gas lighter or
ignitor such as :
cookers / gas boilers / gas hobs...
It uses a high performance planar diffused tech-
nology adapted to high temperature and rugged
environmental conditions.
Th : Thyristor for switching operation.
Z : Zener diode to set the threshold voltage.
D : Diode for reverse conduction.
R : 2 k
resistor.
DESCRIPTION
Z
R
D
Th
pin 2
pin 1/3 (*)
FUNCTIONAL DIAGRAM
IPAK
1
2
3
TAB
n
DEDICATED THYRISTOR STRUCTURE FOR
CAPACITANCE
DISCHARGE
IGNITION
OPERATION
n
HIGH PULSE CURRENT CAPABILITY
240A @ tp= 10
Ķ
s
FEATURES
n
SPACE SAVING THANKS TO MONOLITHIC
FUNCTION INTEGRATION
n
HIGH
RELIABILITY
WITH
PLANAR
TECHNOLOGY
BENEFITS
(*)Pin1 and Pin3 must be shorted together in
the application circuit layout.
FLC10-200H
2/7
Symbol
Parameter
Value
Unit
Rth(j-a)
Thermal resistance junction to ambient
100
į
C/W
THERMAL RESISTANCE
FLC
10
-
200
H
FIRE LIGHTER CIRCUIT
CIRCUIT NUMBER:
SCR + diode + Zener + Resistance
High Power Version
200: V
= 200V
RM
PACKAGE H: IPAK
ORDERING INFORMATION
Symbol
Parameter
Value
Unit
I
TRM
Repetitive surge peak on state current for thyristor
-30
į
C
T
amb
120
į
C
tp = 10
Ķ
s
( note 1)
240
A
I
FRM
Repetitive surge peak on state current for diode
-30
į
C
T
amb
120
į
C
dI/dt
Critical rate of rise time on state current -30
į
C
T
amb
120
į
C
200
A/
Ķ
s
Tstg
Tj
Storage junction temperature range
Maximum junction temperature
- 40 to + 150
+ 125
į
C
Toper
Operating temperature range
-30 + 120
į
C
T
L
Maximum lead temperature for soldering during 10s
260
į
C
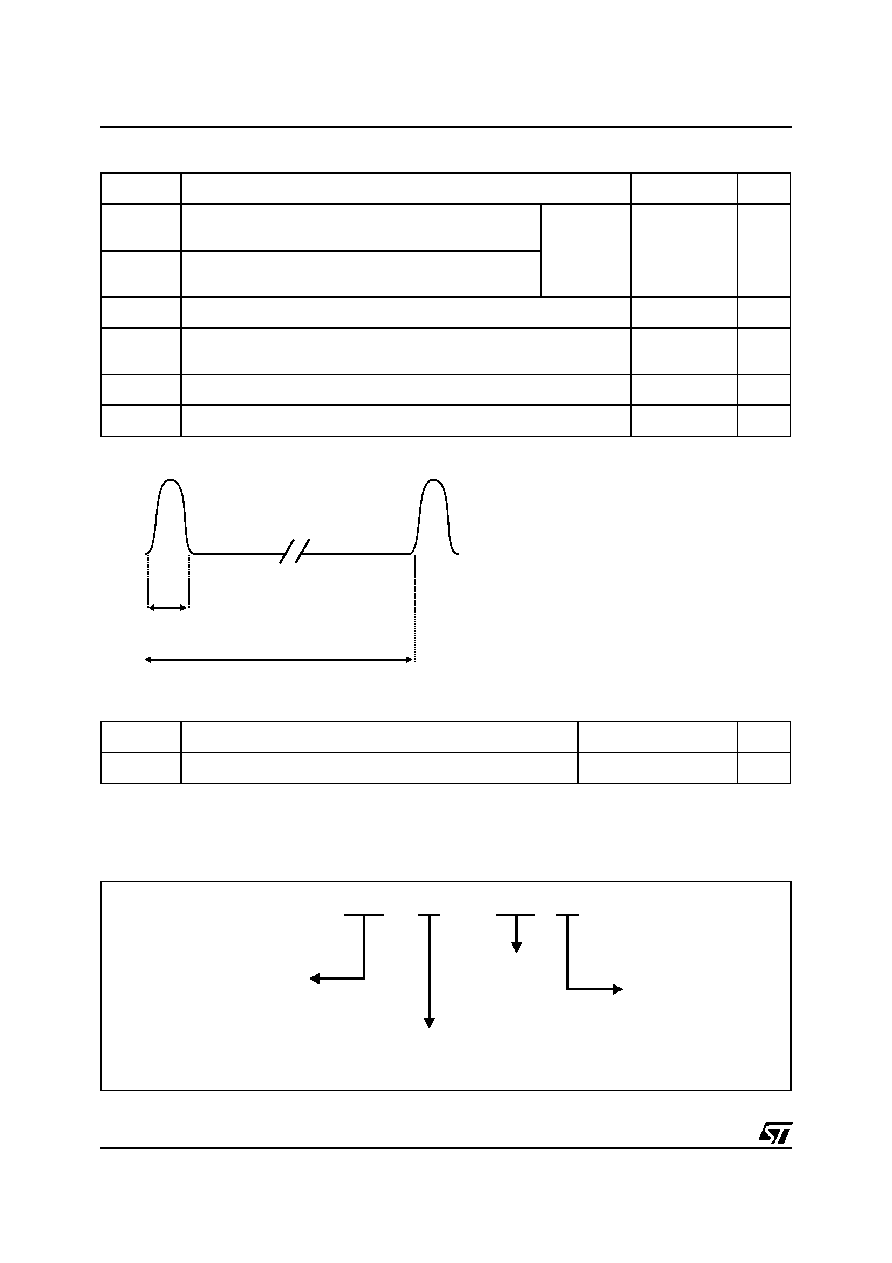
Note 1 : Test current waveform
ABSOLUTE RATINGS (limiting values)
200ms
10
Ķ
s

FLC10-200H
3/7
ELECTRICAL CHARACTERISTICS
Symbol
Parameters
V
RM
Stand-off voltage
V
BO
Breakover voltage
V
T
On-state voltage
V
F
Diode forward voltage drop
I
BO
Breakover current
I
RM
Leakage current
T
Temperature coefficient for V
BO
I
I
F
VF
V
T
IRM
IBO
I T
V
RM
V
BO
V
Symbol
Test Conditions
Value
Unit
V
F
I
F
= 2A
tp
500
Ķ
s
Tj = 25
į
C
Max.
1.7
V
DIODE (D) PARAMETER
Symbol
Test conditions
Min
Typ
Max
Unit
I
RM
V
RM
= 200 V
Tj = 25
į
C
10
Ķ
A
Tj = 125
į
C
100
Ķ
A
V
BO
at I
BO
Tj = 25
į
C
200
225
250
V
I
BO
at V
BO
Tj = 25
į
C
0.5
mA
V
T
I
T
= 2A
tp
500
Ķ
s
Tj = 25
į
C
1.7
V
T
0.3
V/
į
C
THYRISTOR (Th) and ZENER (Z) PARAMETERS
-20
0
20
40
60
80
100
0
0.5
1
1.5
2
2.5
Tj (
į
C)
k = I
(Tj) / I
(25
į
C)
BO
BO
Fig.1: Relative variation of breakover current
versus junction temperature.

FLC10-200H
4/7
Rs
Ds
c
D
Th
Z
R
Ic
AC
MAINS
Ic
t
Fig. 2: BASIC APPLICATION
The applications of the lighter using the capaci-
tance discharge topology operate in 2 phases :
PHASE 1
The energy coming from the mains is stored into
the capacitor C. For that, the AC voltage is rectified
by the diode Ds.
PHASE 2
At the end of the phase 1, the voltage across the
capacitor C reaches the avalanche threshold of
the zener. Then a current flows through the gate of
the thyristor Th which fires.
The firing of the thyristor causes an alternating
current to flow through the capacitor C.
The positive parts of this current flow through C,
Th and the primary of the HV transformer.
The negative parts of the current flow through C,
D and the primaty of the HV transformer.
The maximum Rs value is equal to :
Rs
V
V
T
T
k I
AC
BO
amb
BO
max
(
min.
)
[
max .(
.(
))]
.
*
=
-
+
-
2
1
25
* : see fig 1
COMPONENT CHOICE
RS RESISTOR CALCULATION
The Rs resistor allows, in addition with the capacitor C, to adjust the spark frequency and to limit the
current from the mains. Its value shall allow the thyristor Th to fire even in worst case conditions. In this
borderline case, the system must fire with the lowest value of RMS mains voltage while the breakdown
voltage and current of the FLC are at the maximum.

FLC10-200H
5/7
Fig. 4: Voltage across the capacitance with Rs = 15k
, C = 1
Ķ
F and V
BO
= 225V.
4.7
6.8
10
12
15
18
22
27 30
1
2
3
5
10
20
F (Hz)
Rs (k )
Vac=220Vrms, Vbo=225V, Tamb=25
į
C
C=3.3
F
Ķ
C=2.7
F
Ķ
C=2.2
F
Ķ
C=0.47
F
Ķ
C=0.47
F
Ķ
C=1
F
Ķ
C=1
F
Ķ
C=1.5
F
Ķ
C=1.5
F
Ķ
Fig. 3 : Spark frequency versus Rs and C
The couple Rs/C can be chosen with the previous
curve. Keep in mind the Rs maximum limit for
which the system would not work when the AC
mains is minimum. The next curve shows the be-
havior with Rs=15k
and C=1
Ķ
F.