 | ÐлекÑÑоннÑй компоненÑ: AD8017 | СкаÑаÑÑ:  PDF PDF  ZIP ZIP |
Äîêóìåíòàöèÿ è îïèñàíèÿ www.docs.chipfind.ru
REV. A
Information furnished by Analog Devices is believed to be accurate and
reliable. However, no responsibility is assumed by Analog Devices for its
use, nor for any infringements of patents or other rights of third parties
which may result from its use. No license is granted by implication or
otherwise under any patent or patent rights of Analog Devices.
a
AD8017
One Technology Way, P.O. Box 9106, Norwood, MA 02062-9106, U.S.A.
Tel: 781/329-4700
World Wide Web Site: http://www.analog.com
Fax: 781/326-8703
© Analog Devices, Inc., 2000
Dual High Output Current,
High Speed Amplifier
PIN CONFIGURATION
8-Lead Thermal Coastline SOIC (SO-8)
8
7
6
5
1
2
3
4
OUT1
IN1
+IN1
V
S
+V
S
OUT2
IN2
+IN2
AD8017
+
+
FEATURES
High Output Drive Capability
20 V p-p Differential Output Voltage, R
L
= 50
10 V p-p Single-Ended Output Voltage While
Delivering 200 mA to a 25 Load
Low Power Operation
+5 V to +12 V Voltage Supply @ 7 mA/Amplifier
Low Distortion
78 dBc @ 500 kHz SFDR, R
L
= 100 , V
O
= 2 V p-p
58 dBc Highest Harmonic @ 1 MHz, I
O
= 270 mA
(R
L
= 10 )
High Speed
160 MHz, 3 dB Bandwidth (G = +2)
1600 V/ s Slew Rate
APPLICATIONS
xDSL PCI Cards
Consumer DSL Modems
Line Driver
Video Distribution
PRODUCT DESCRIPTION
The AD8017 is a low cost, dual high speed amplifier capable of
driving low distortion signals to within 1.0 V of the supply rail.
It is intended for use in single supply xDSL systems where low
distortion and low cost are essential. The amplifiers will be able
to drive a minimum of 200 mA of output current per amplifier.
The AD8017 will deliver 78 dBc of SFDR at 500 kHz, required
for many xDSL applications.
Fabricated in ADI's high speed XFCB process, the high band-
width and fast slew rate of the AD8017 keep distortion to a
minimum, while dissipating a minimum amount of power. The
quiescent current of the AD8017 is 7 mA/amplifier.
Low distortion, high output voltage drive, and high output
current drive make the AD8017 ideal for use in low cost Cus-
tomer Premise End (CPE) equipment for ADSL, SDSL, VDSL
and proprietary xDSL systems.
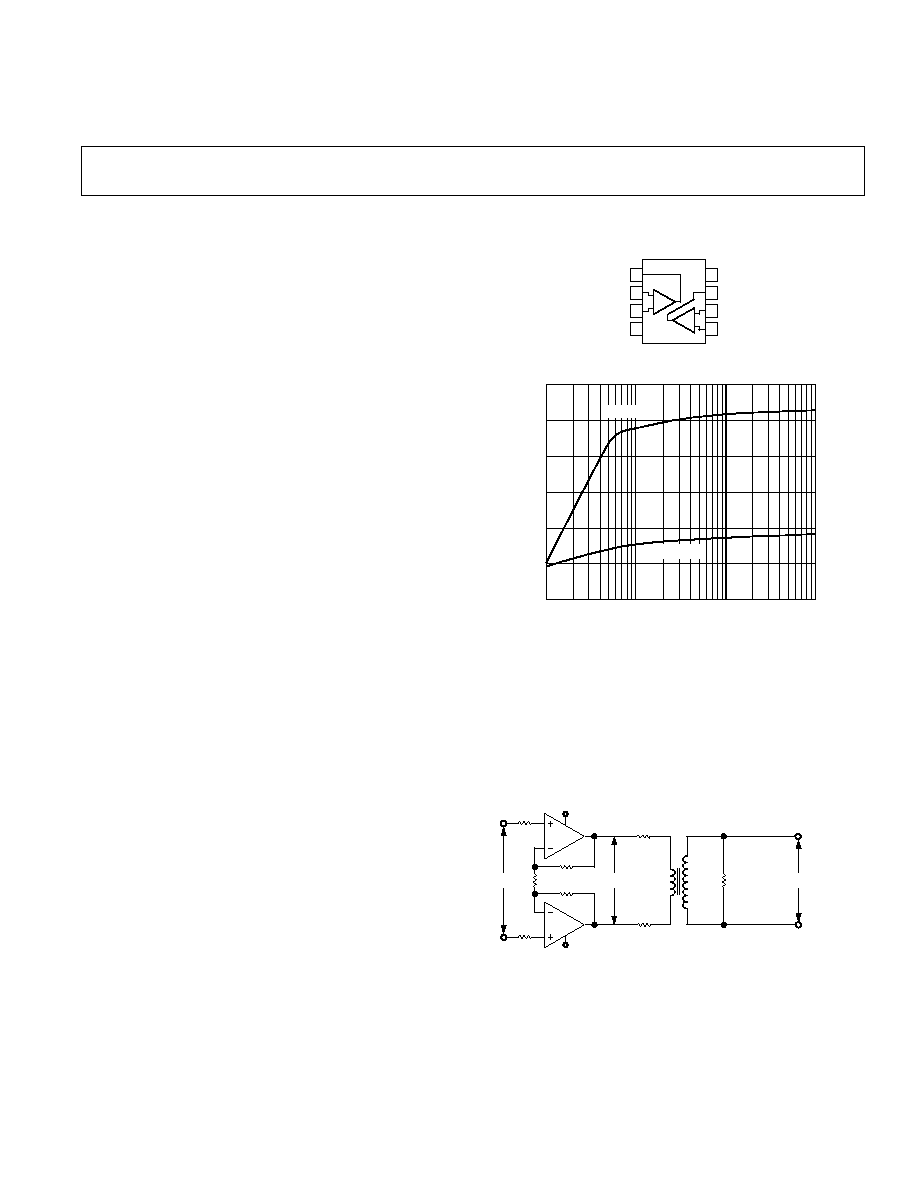
LOAD RESISTANCE
0
1
1000
OUTPUT VOLTAGE SWING
V p-p
6
100
10
2
4
8
10
12
V
S
= 2.5V
V
S
= 6V
Figure 1. Output Swing vs. Load Resistance
The AD8017 drive capability comes in a very compact form.
Utilizing ADI's proprietary Thermal Coastline SOIC package,
the AD8017's total (static and dynamic) power on +12 V sup-
plies is easily dissipated without external heatsink, other than to
place the AD8017 on a 4-layer PCB.
The AD8017 will operate over the commercial temperature
range 40
°C to +85°C.
+V
S
R1
+
V
S
R2
N
P
:N
S
TRANSFORMER
V
IN
V
REF
V
OUT
LINE
POWER
IN dB
+
R
L
= 100
OR
135
Figure 2. Differential Drive Circuit for xDSL Applications

2
REV. A
AD8017SPECIFICATIONS
Parameter
Conditions
Min
Typ
Max
Unit
DYNAMIC PERFORMANCE
3 dB Bandwidth
G = +2, V
OUT
< 0.4 V p-p
100
160
MHz
0.1 dB Bandwidth
V
OUT
< 0.4 V p-p
70
MHz
Large Signal Bandwidth
V
OUT
= 4 V p-p
105
MHz
Slew Rate
Noninverting, V
OUT
= 2 V p-p, G = +2
1600
V/
µs
Rise and Fall Time
Noninverting, V
OUT
= 2 V p-p
2.6
ns
Settling Time
0.1%, V
OUT
= 4 V Step
35
ns
Overload Recovery
V
IN
= 5 V p-p
74
ns
NOISE/HARMONIC PERFORMANCE
Distortion
V
OUT
= 2 V p-p
2nd Harmonic
500 kHz, R
L
= 100
/25
78/71
dBc
1 MHz, R
L
= 100
/25
76/69
dBc
3rd Harmonic
500 kHz, R
L
= 100
/25
105/91
dBc
1 MHz, R
L
= 100
/25
81/72
dBc
IP3
500 kHz, R
L
= 100
/25
40/35
dBm
IMD
500 kHz, R
L
= 100
/25
76/66
dBc
MTPR
26 kHz to 1.1 MHz
66
dBc
Input Noise Voltage
f = 10 kHz
1.9
nV/
Hz
Input Noise Current
f = 10 kHz (+ Inputs)
23
pA
Hz
f = 10 kHz ( Inputs)
21
pA
Hz
Crosstalk
f = 5 MHz, G = +2
66
dB
DC PERFORMANCE
Input Offset Voltage
1.8
3.0
mV
T
MIN
T
MAX
4.0
mV
Open Loop Transimpedance
V
OUT
= 2 V p-p
185
700
k
T
MIN
T
MAX
143
k
INPUT CHARACTERISTICS
Input Resistance
+Input
50
k
Input Capacitance
+Input
2.4
pF
Input Bias Current (+)
16
±45
µA
T
MIN
T
MAX
±67
µA
Input Bias Current ()
1.0
±25
µA
T
MIN
T
MAX
±32
µA
CMRR
V
CM
=
±2.5 V
59
63
dB
Input CM Voltage Range
±5.1
V
OUTPUT CHARACTERISTICS
Output Resistance
0.2
Output Voltage Swing
R
L
= 25
±4.6
±5.0
V
Output Current
1
Highest Harmonic < 58 dBc,
200
270
mA
f = 1 MHz, R
L
= 10
T
MIN
T
MAX
, Highest Harmonic < 52 dBc
100
mA
Short-Circuit Current
1500
mA
POWER SUPPLY
Supply Current/Amp
7.0
7.7
mA
T
MIN
T
MAX
7.8
mA
Operating Range
Dual Supply
±2.2
±6.0
V
Power Supply Rejection Ratio
58
61
dB
Operating Temperature Range
40
+85
°C
NOTES
1
Output current is defined here as the highest current load delivered by the output of each amplifier into a specified resistive load ( R
L
= 10
), while maintaining an
acceptable distortion level (i.e., less than 60 dBc highest harmonic) at a given frequency (f = 1 MHz).
Specifications subject to change without notice.
(@ +25 C, V
S
= 6 V, R
L
= 100
, R
F
= R
G
= 619
, unless otherwise noted)

3
REV. A
AD8017
SPECIFICATIONS
(@ +25 C, V
S
= 2.5 V, R
L
= 100
, R
F
= R
G
= 619
, unless otherwise noted)
Parameter
Conditions
Min
Typ
Max
Unit
DYNAMIC PERFORMANCE
3 dB Bandwidth
G = +2, V
OUT
< 0.4 V p-p
75
120
MHz
0.1 dB Bandwidth
V
OUT
< 0.4 V p-p
40
MHz
Large Signal Bandwidth
V
OUT
= 4 V p-p
100
MHz
Slew Rate
Noninverting, V
OUT
= 2 V p-p, G = +2
800
V/
µs
Rise and Fall Time
Noninverting, V
OUT
= 2 V p-p
2.0
ns
Settling Time
0.1%, V
OUT
= 2 V Step
35
ns
Overload Recovery
V
IN
= 2.5 V p-p
74
ns
NOISE/HARMONIC PERFORMANCE
Distortion
V
OUT
= 2 V p-p
2nd Harmonic
500 kHz, R
L
= 100
/25
75/68
dBc
1 MHz, R
L
= 100
/25
73/66
dBc
3rd Harmonic
500 kHz, R
L
= 100
/25
91/88
dBc
1 MHz, R
L
= 100
/25
79/74
dBc
IP3
500 kHz, R
L
= 100
/25
40/36
dBm
IMD
500 kHz, R
L
= 100
/25
78/64
dBc
MTPR
26 kHz to 1.1 MHz
66
dBc
Input Noise Voltage
f = 10 kHz
1.8
nV/
Hz
Input Noise Current
f = 10 kHz (+ Inputs)
23
pA
Hz
f = 10 kHz ( Inputs)
21
pA
Hz
Crosstalk
f = 5 MHz, G = +2
66
dB
DC PERFORMANCE
Input Offset Voltage
0.8
2.0
mV
T
MIN
T
MAX
2.6
mV
Open Loop Transimpedance
V
OUT
= 2 V p-p
40
166
k
T
MIN
T
MAX
45
k
INPUT CHARACTERISTICS
Input Resistance
+Input
50
k
Input Capacitance
+Input
2.4
pF
Input Bias Current (+)
16
±40
µA
T
MIN
T
MAX
±62
µA
Input Bias Current ()
2
±25
µA
T
MIN
T
MAX
±32
µA
CMRR
V
CM
=
±1.0 (±1.0)
57
60
dB
Input CM Voltage Range
±1.6
V
OUTPUT CHARACTERISTICS
Output Resistance
0.2
Output Voltage Swing
R
L
= 25
±1.55
±1.65
V
Output Current
1
Highest Harmonic < 55 dBc,
100
120
mA
f = 1 MHz, R
L
= 10
T
MIN
T
MAX
Highest Harmonic
< 50 dBc
60
mA
Short-Circuit Current
1300
mA
POWER SUPPLY
Supply Current/Amp
6.2
7
mA
T
MIN
T
MAX
7.3
mA
Operating Range
Dual Supply
±2.2
±6.0
V
Power Supply Rejection Ratio
59
62
dB
Operating Temperature Range
40
+85
°C
NOTES
1
Output current is defined here as the highest current load delivered by the output of each amplifier into a specified resistive load ( R
L
= 10
), while maintaining an
acceptable distortion level (i.e., less than 60 dBc highest harmonic) at a given frequency (f = 1 MHz).
Specifications subject to change without notice.
AD8017
4
REV. A
ABSOLUTE MAXIMUM RATINGS
1
Supply Voltage . . . . . . . . . . . . . . . . . . . . . . . . . . . . . . . . 13.2 V
Internal Power Dissipation
2
Small Outline Package (R) . . . . . . . . . . . . . . . . . . . . . . . 1.3 W
Input Voltage (Common Mode) . . . . . . . . . . . . . . . . . . . .
±V
S
Differential Input Voltage . . . . . . . . . . . . . . . . . . . . . .
±2.5 V
Output Short Circuit Duration
. . . . . . . . . . . . . . . . . . . . Observe Power Derating Curves
Storage Temperature Range . . . . . . . . . . . . 65
°C to +125°C
Operating Temperature Range . . . . . . . . . . . 40
°C to +85°C
Lead Temperature Range (Soldering 10 sec) . . . . . . . . +300
°C
NOTES
1
Stresses above those listed under Absolute Maximum Ratings may cause perma-
nent damage to the device. This is a stress rating only; functional operation of the
device at these or any other conditions above those indicated in the operational
section of this specification is not implied. Exposure to absolute maximum rating
conditions for extended periods may affect device reliability.
2
Specification is for device on a two-layer board with 2500 mm
2
of 2 oz. copper at
+25
°C 8-lead SOIC package:
JA
= 95.0
°C/W.
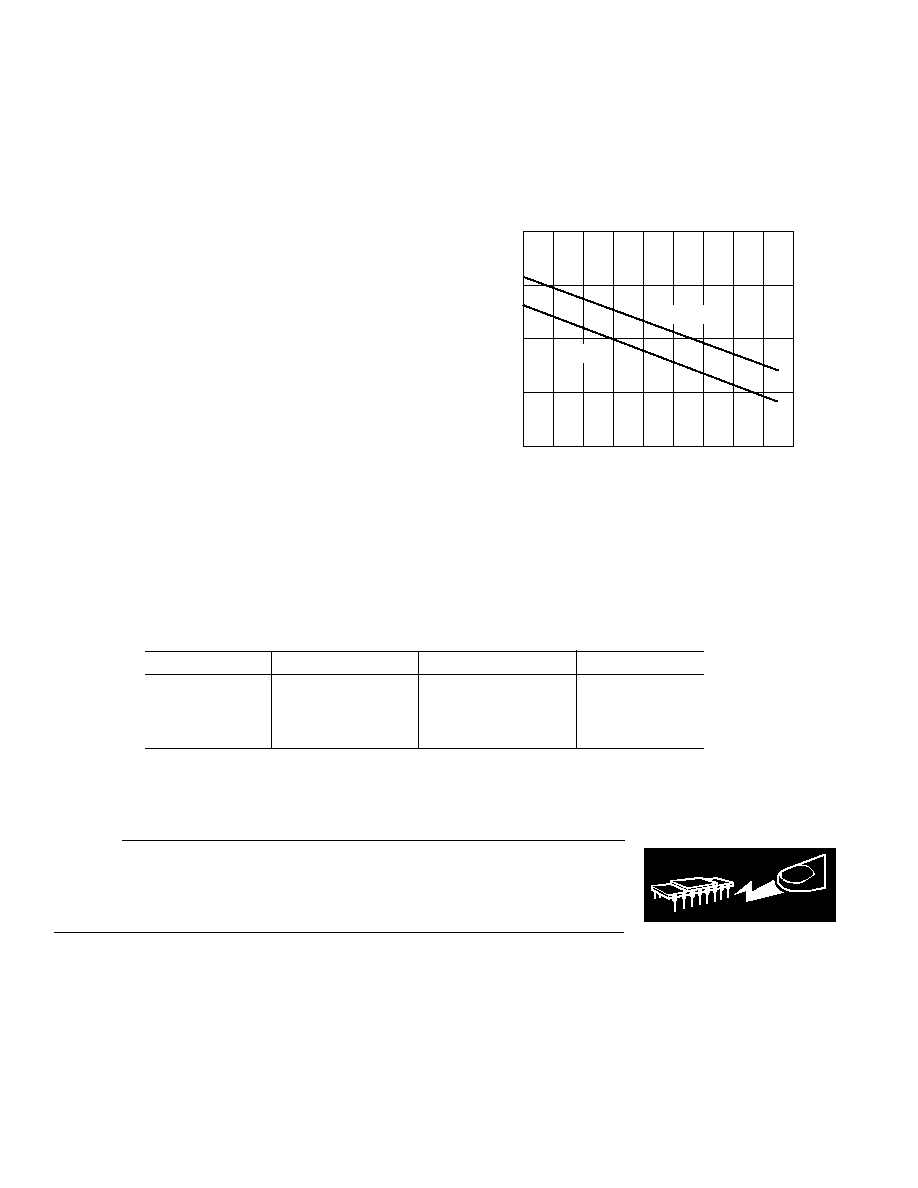
MAXIMUM POWER DISSIPATION
The maximum power that can be safely dissipated by the AD8017
is limited by the associated rise in junction temperature. The
maximum safe junction temperature for plastic encapsulated
device is determined by the glass transition temperature of the
plastic, approximately +150
°C. Temporarily exceeding this limit
may cause a shift in parametric performance due to a change in
the stresses exerted on the die by the package. Exceeding a junc-
tion temperature of +175
°C for an extended period can result in
device failure.
CAUTION
ESD (electrostatic discharge) sensitive device. Electrostatic charges as high as 4000 V readily
accumulate on the human body and test equipment and can discharge without detection.
Although the AD8017 features proprietary ESD protection circuitry, permanent damage may
occur on devices subjected to high-energy electrostatic discharges. Therefore, proper ESD
precautions are recommended to avoid performance degradation or loss of functionality.
WARNING!
ESD SENSITIVE DEVICE
The output stage of the AD8017 is designed for maximum load
current capability. As a result, shorting the output to common
can cause the AD8017 to source or sink 500 mA. To ensure
proper operation, it is necessary to observe the maximum power
derating curves. Direct connection of the output to either power
supply rail can destroy the device.
AMBIENT TEMPERATURE C
2.0
1.5
0
0
90
10
MAXIMUM POWER DISSIPATION
Watts
20
30
40
50
60
70
80
1.0
0.5
T
J
= +150 C
T
J
= +125 C
Figure 3. Plot of Maximum Power Dissipation vs.
Temperature for AD8017
ORDERING GUIDE
Model
Temperature Range
Package Description
Package Option
AD8017AR
40
°C to +85°C
8-Lead SOIC
SO-8
AD8017AR-REEL
40
°C to +85°C
Tape and Reel 13"
SO-8
AD8017AR-REEL7
40
°C to +85°C
Tape and Reel 7"
SO-8
AD8017AR-EVAL
Evaluation Board
AD8017
5
REV. A
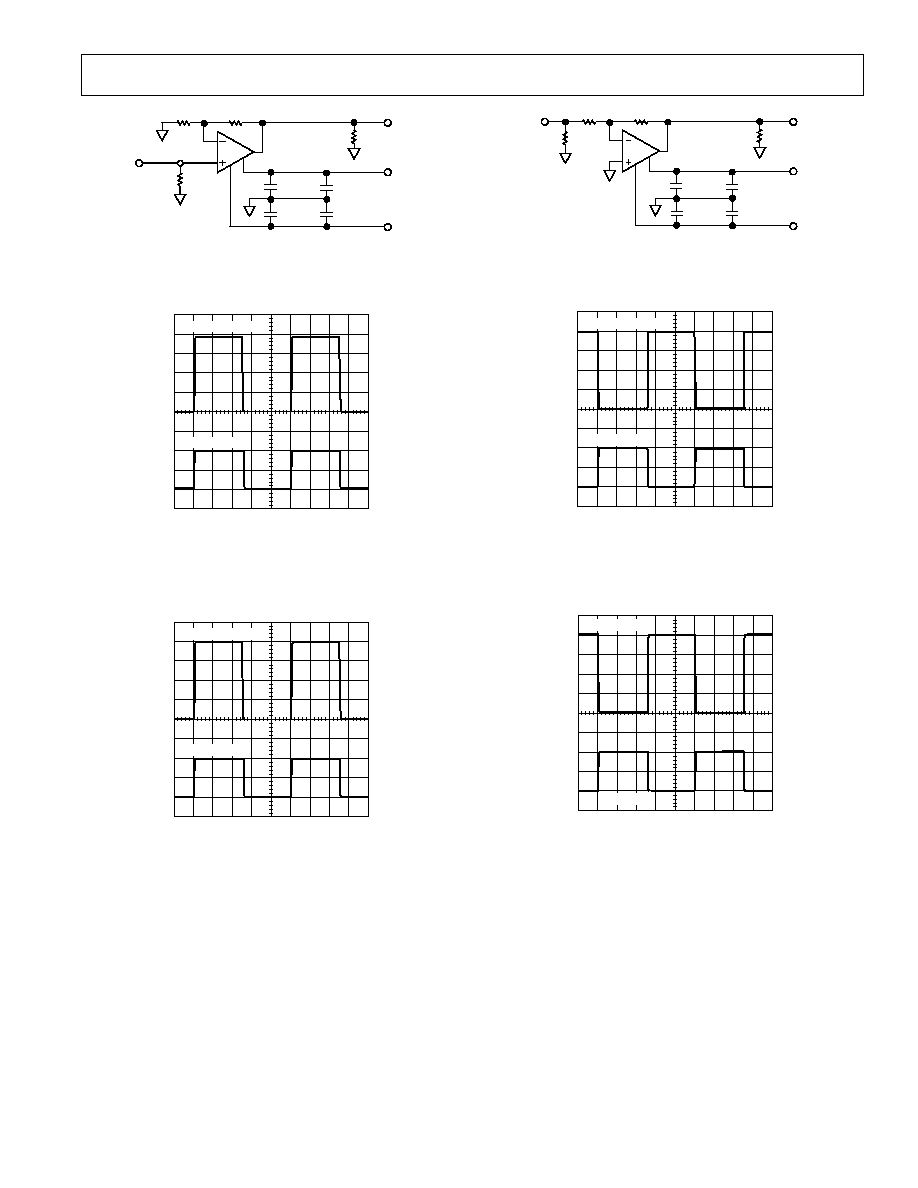
Typical Performance Characteristics
619
619
R
L
V
OUT
+V
S
V
S
10 F
10 F
+
+
0.1 F
0.1 F
49.9
V
IN
Figure 4. Test Circuit: Gain = +2
OUTPUT = 100mV
INPUT = 50mV
200ns/DIV
25mV/DIV
Figure 5. 100 mV Step Response; G = +2, V
S
=
±2.5 V or
±6 V, R
L
= 100
OUTPUT = 4V
INPUT = 2V
200ns/DIV
1V/DIV
Figure 6. 4 V Step Response; G = +2, V
S
=
±6 V,
R
L
= 100
619
619
R
L
V
OUT
+V
S
V
S
10 F
10 F
+
+
0.1 F
0.1 F
54.4
V
IN
Figure 7. Test Circuit: Gain = 1
OUTPUT = 100mV
INPUT = 100mV
200ns/DIV
50mV/DIV
25
mV/DIV
Figure 8. 100 mV Step Response; G = 1, V
S
=
±2.5 V or
±6 V, R
L
= 100
OUTPUT = 4V
INPUT = 4V
200ns/DIV
2V/DIV
1V/DIV
Figure 9. 4 V Step Response; G = 1, V
S
=
±6 V,
R
L
= 100
AD8017
6
REV. A
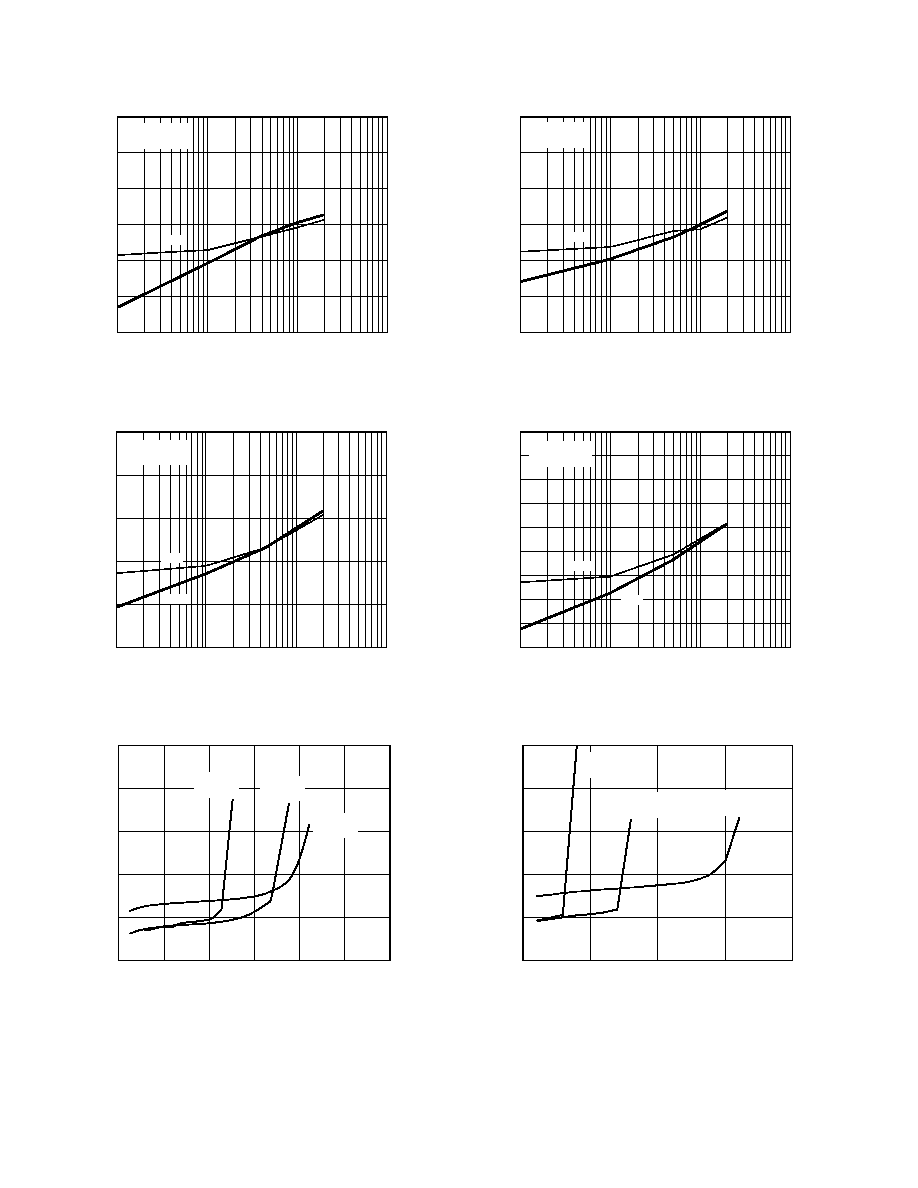
V
OUT
= 2V p-p
G = +2
FREQUENCY MHz
0
120
0.1
100
DISTORTION
dBc
60
10
1
20
40
80
100
2ND
3RD
Figure 10. Distortion vs. Frequency; V
S
=
±6 V, R
L
= 100
FREQUENCY MHz
0
0.1
100
DISTORTION
dBc
60
10
1
20
40
80
100
2ND
3RD
V
OUT
= 2V p-p
G = +2
Figure 11. Distortion vs. Frequency; V
S
=
±6 V, R
L
= 25
OUTPUT CURRENT mA
HIGHEST HARMONIC DISTORTION
dBc
70
0
500
30
100
200
300
400
60
50
40
V
S
= 6V
R
L
= 25
20
600
V
S
= 6V
R
L
= 10
V
S
= 6V
R
L
= 5
Figure 12. Distortion vs. Output Current; V
S
=
±6 V,
f = 1 MHz, G = +2
FREQUENCY MHz
0
120
0.1
100
DISTORTION
dBc
60
10
1
20
40
80
100
2ND
3RD
V
OUT
= 2V p-p
G = +2
Figure 13. Distortion vs. Frequency; V
S
=
±2.5 V, R
L
= 100
FREQUENCY MHz
0
90
0.1
100
DISTORTION
dBc
60
10
1
40
50
70
80
2ND
3RD
30
20
10
V
OUT
= 2V p-p
G = +2
Figure 14. Distortion vs. Frequency; V
S
=
±2.5 V, R
L
= 25
OUTPUT CURRENT mA
20
HIGHEST HARMONIC DISTORTION
dBc
60
70
50
400
100
200
V
S
= 2.5V
R
L
= 25
0
300
40
30
V
S
= 2.5V
R
L
= 10
V
S
= 2.5V
R
L
= 5
Figure 15. Distortion vs. Output Current; V
S
=
±2.5 V,
f = 1 MHz, G = +2
AD8017
7
REV. A
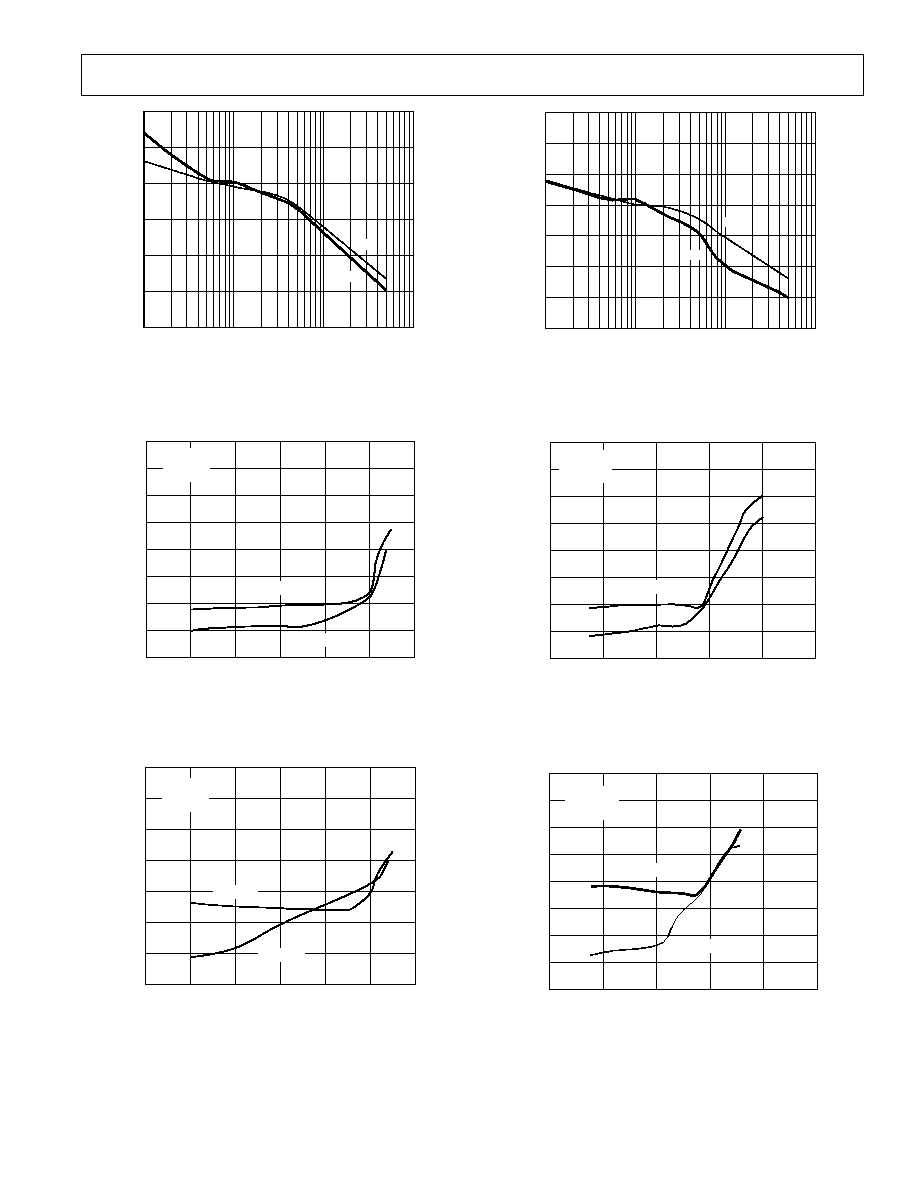
LOAD RESISTANCE
0
1000
DISTORTION
dBc
100
10
40
20
60
80
100
140
120
3RD
2ND
Figure 16. Distortion vs. R
L
, V
S
=
±6 V, G = +2, V
OUT
= 2 V p-p,
f = 1 MHz
R
L
= 100
OUTPUT VOLTAGE Volts
HIGHEST HARMONIC DISTORTION
dBc
80
0
6
0
R
L
= 25
V
S
= 6V
f = 1MHz
G = +2
20
40
60
5
4
3
2
1
10
30
50
70
Figure 17. Distortion vs. Output Voltage, V
S
=
±6 V, G = +2,
f = 1 MHz
OUTPUT VOLTAGE Volts
70
6
HIGHEST HARMONIC DISTORTION
dBc
0
R
L
= 25
V
S
= 6V
f = 10MHz
G = +2
40
50
60
5
4
3
2
1
R
L
= 100
30
20
10
0
Figure 18. Distortion vs. Output Voltage, V
S
=
±6 V, G = +2,
f = 10 MHz
LOAD RESISTANCE
0
140
0
1000
DISTORTION
dBc
60
100
10
20
40
80
100
2ND
3RD
120
Figure 19. Distortion vs. R
L
, V
S
=
±2.5 V, G = +2,
V
OUT
= 2 V p-p, f = 1 MHz
0
0.5
OUTPUT VOLTAGE Volts
80
HIGHEST HARMONIC DISTORTION
dBc
R
L
= 25
V
S
= 2.5V
f = 1MHz
G = +2
40
50
60
R
L
= 100
30
10
0
20
1.0
1.5
2.0
2.5
70
Figure 20. Distortion vs. Output Voltage, V
S
=
±2.5 V,
G = +2, f = 1 MHz
OUTPUT VOLTAGE Volts
0
60
0
2.5
0.5
HIGHEST HARMONIC DISTORTION
dBc
1
1.5
10
20
30
40
50
R
L
= 25
R
L
= 100
V
S
= 2.5V
f = 10MHz
G = +2
70
80
2
Figure 21. Distortion vs. Output Voltage, V
S
=
±2.5 V,
G = +2, f = 10 MHz
AD8017
8
REV. A
FREQUENCY MHz
0
100
NORMALIZED GAIN
dB
10
1
3
1000
3
6
GAIN = +5
GAIN = +2
GAIN = +10
R
L
= 100
Figure 22. Frequency Response; V
S
=
±6 V
FREQUENCY MHz
0.1
1000
1
0.1dB FLATNESS
dB
10
100
0.3
0.2
0.3
0.1
0.0
0.1
0.2
G = +2
R
L
= 100
Figure 23. Gain Flatness; V
S
=
±6 V
FREQUENCY MHz
0.1
1000
1
OUTPUT VOLTAGE
dBV
10
100
0
15
3
6
9
12
18
21
24
27
30
V
OUT
= 2V p-p
G = +2
R
L
= 100
33
Figure 24. Output Voltage vs. Frequency; V
S
=
±6 V
FREQUENCY MHz
2
1
0.1
1000
1
NORMALIZED GAIN
dB
10
100
0
1
6
2
3
4
5
GAIN = +2
GAIN = +10
GAIN = +5
R
L
= 100
Figure 25. Frequency Response; V
S
=
±2.5 V
FREQUENCY MHz
0.1
1000
1
0.1dB FLATNESS
dB
10
100
0.3
0.2
0.3
0.1
0.0
0.1
0.2
G = +2
R
L
= 100
Figure 26. Gain Flatness; V
S
=
±2.5 V
FREQUENCY MHz
0.1
1000
1
OUTPUT VOLTAGE
dBV
10
100
3
0
15
3
6
9
12
18
21
24
27
30
V
OUT
= 1V
RMS
G = +2
R
L
= 100
Figure 27. Output Voltage vs. Frequency; V
S
=
±2.5 V
AD8017
9
REV. A
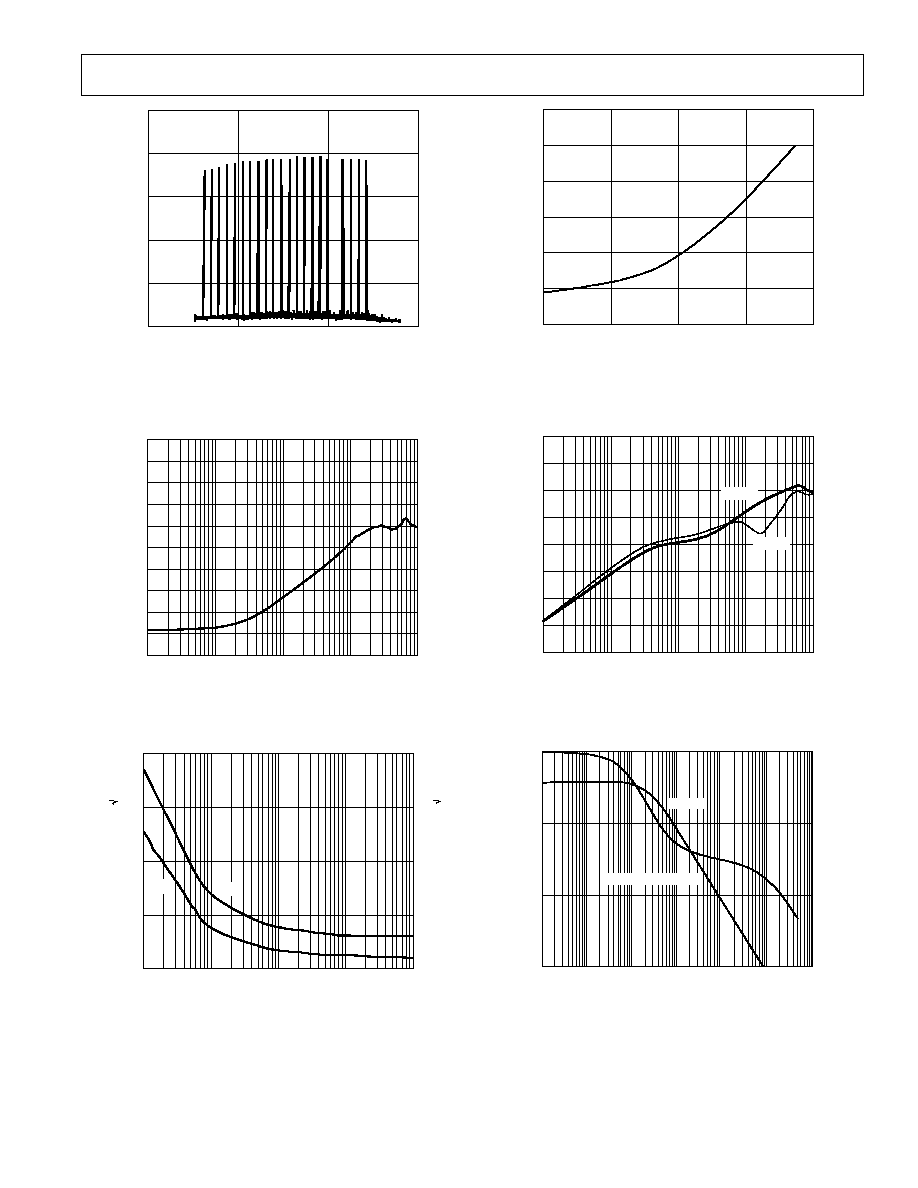
FREQUENCY kHz
+20
80
POWER
dBm
20
40
60
0
0
50
100
150
Figure 28. Multitone Power Ratio: V
S
=
±6 V, 13 dBm
Output Power into 25
FREQUENCY MHz
0.1
1000
1
CMRR
dB
10
100
0
50
10
20
30
40
60
70
80
90
100
Figure 29. CMRR vs. Frequency; V
S
=
±6 V or V
S
=
±2.5 V
FREQUENCY kHz
0.01
100
0.1
INPUT CURRENT NOISE
nA/
Hz
1
10
0.4
0.3
0.1
0
0.2
12
10
6
0
8
4
2
INPUT VOLTAGE NOISE
nA/
Hz
i
N
e
N
Figure 30. Noise vs. Frequency
SERIES RESISTANCE
120
20
CAP LOAD
pF
80
60
40
100
0
2
4
8
0
6
Figure 31. R
S
and C
L
vs. 30% Overshoot
FREQUENCY MHz
0.1
1000
1
PSRR
dB
10
100
0
50
10
20
30
40
60
70
80
PSRR
+PSRR
Figure 32. PSRR vs. Frequency; V
S
=
±6 V or V
S
=
±2.5 V
FREQUENCY MHz
0.001
10
TRANSIMPEDANCE
k
0.1
1
1
180
0
120
60
PHASE
Degrees
1000
100
100
TRANSIMPEDANCE
PHASE
10
1000
0.01
Figure 33. Open-Loop Transimpedance and Phase vs.
Frequency
AD8017
10
REV. A
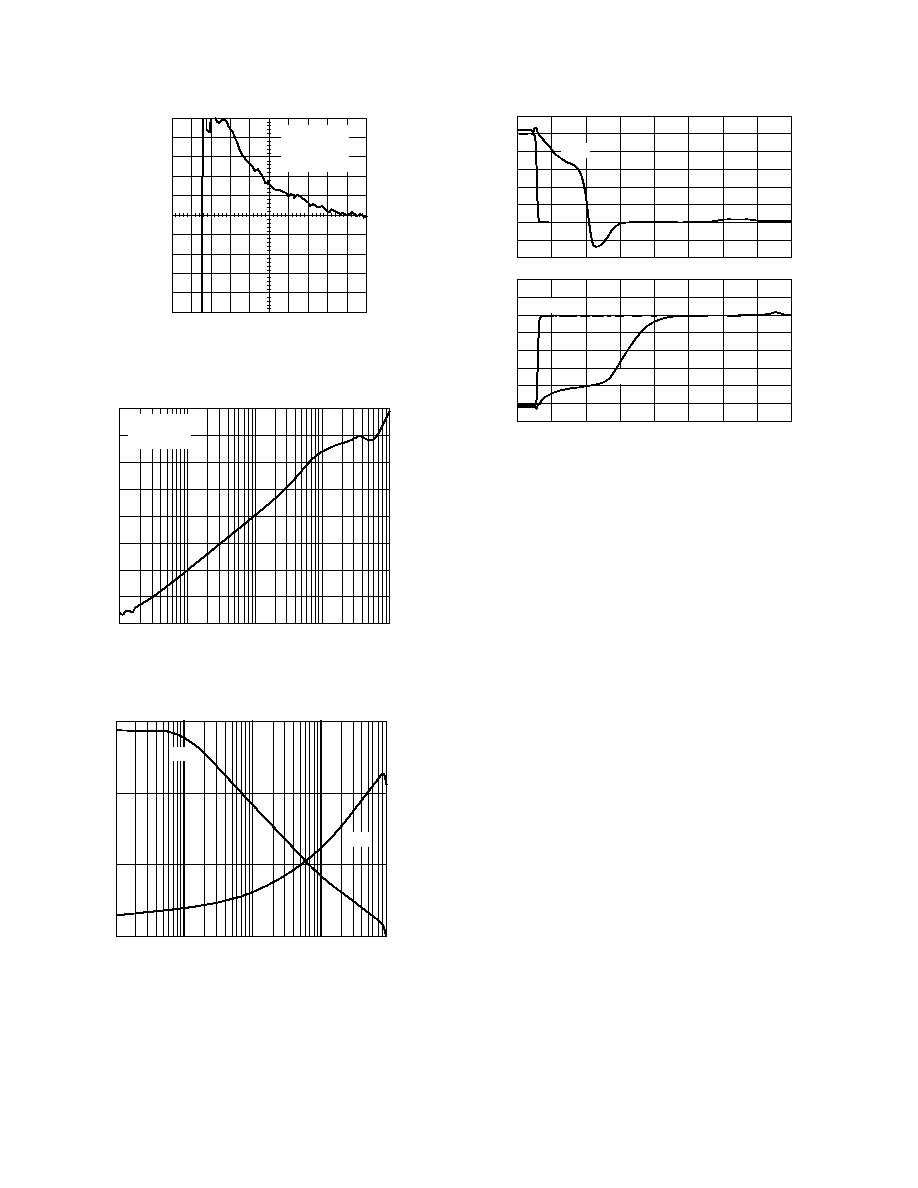
TIME ns
OUTPUT VOLTAGE ERROR
mV/DIV (%
/DIV)
G = +2
V
OUT
= 2V
STEP
R
L
- 100
V
S
= 6V
+2mV
(+0.1%)
2mV
(+0.1%)
0
10
20
30 40
50 60
70 80
90
0
Figure 34. Settling Time; V
S
=
±6.0 V
FREQUENCY MHz
0.1
1000
1
CROSSTALK
dB
10
100
50
20
30
40
60
70
80
V
OUT
= 2V p-p
G = +2
R
L
= 100
90
100
Figure 35. Output Crosstalk vs. Frequency
FREQUENCY MHz
0.1
100
INPUT IMPEDANCE
1
10
100
0.1
10
1
OUTPUT IMPEDANCE
1000
1000
10000
100000
Z
IN
Z
OUT
1000000
Figure 36. Input and Output Impedance vs. Frequency
VOLTS
2
1
0
1
2
3
4
5
6
10
10
30
50
70
90
110
130
150
VOLTS
6
5
4
3
2
10
10
30
50
70
90
110
130
150
3
3
0
1
V
OUT
V
IN
V
OUT
V
IN
TIME ns
Figure 37. Overload Recovery; V
S
=
±6 V, G = +2,
R
L
= 100
, V
IN
= 5 V p-p, T = 1
µs
AD8017
11
REV. A
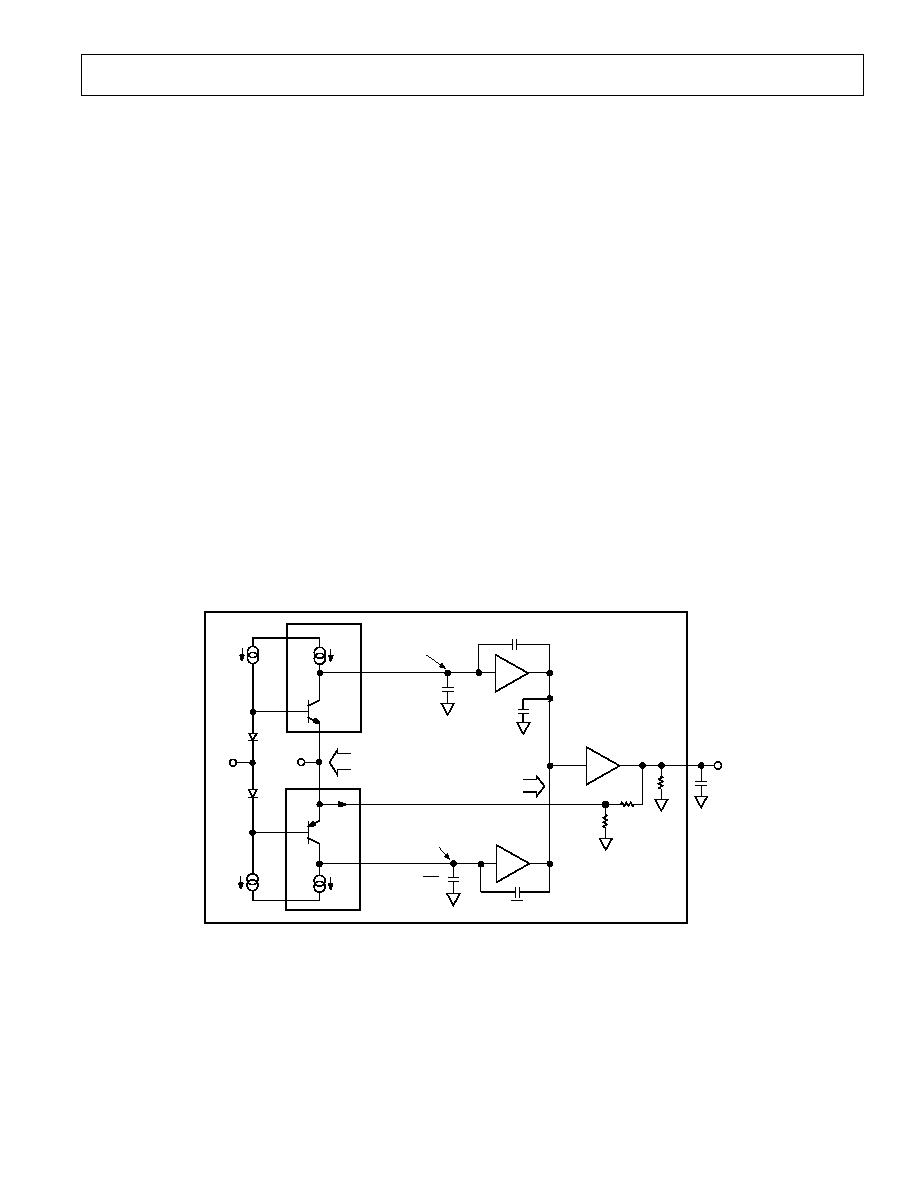
THEORY OF OPERATION
The AD8017 is a dual high speed CF amplifier that attains new
levels of bandwidth (BW), power, distortion and signal swing,
under heavy current loads. Its wide dynamic performance (in-
cluding noise) is the result of both a new complementary high
speed bipolar process and a new and unique architectural
design. The AD8017 basically uses a two gain stage complemen-
tary design approach versus the traditional "single stage"
complementary mirror structure sometimes referred to as the
Nelson amplifier. Though twin stages have been tried before,
they typically consumed high power since they were of a folded
cascode design much like the AD9617.
This design allows for the standing or quiescent current to add
to the high signal or slew current-induced stages. In the time
domain, the large signal output rise/fall time and slew rate is
typically controlled by the small signal BW of the amplifier and
the input signal step amplitude respectively, not the dc quies-
cent current of the gain stages (with the exception of input level
shift diodes Q1/Q2). Using two stages as opposed to one, also
allows for a higher overall gain bandwidth product (GBWP) for
the same power, thus providing lower signal distortion and the
ability to drive heavier external loads. In addition, the second
gain stage also isolates (divides down) A3's input reflected load
drive and the nonlinearities created resulting in relatively lower
distortion and higher open-loop gain. See Figure 38.
Overall, when "high" external load drive and low ac distortion is
a requirement, a twin gain stage integrating amplifier like the
AD8017 will provide excellent results for low power over the
traditional single stage complementary devices. In addition,
being a CF amplifier, closed-loop BW variations versus external
gain variations (varying R
G
) will be much lower compared to a
VF op amp, where the BW varies inversely with gain. Another
key attribute of this amplifier is its ability to run on a single 5 V
supply due in part to its wide common-mode input and output
voltage range capability. For 5 V supply operation, the device
obviously consumes less than half the quiescent power (vs. 12 V
supply) with little degradation in its ac and dc performance
characteristics. See specification pages for comparisons.
DC GAIN CHARACTER
Gain stages A1/
A1 and A2/A2 combined provide negative
feedforward transresistance gain. See Figure 38. Stage A3 is a
unity gain buffer which provides external load isolation to A2.
Each stage uses a symmetrical complementary design. (A3 is
also complementary, though not explicitly shown). This is done
to reduce both second order signal distortion and overall quies-
cent power as discussed above. In the quasi dc-to-low frequency
region, the closed loop gain relationship can be approximated as:
G = 1+R
F
/R
G
for Noninverting Operation
G = R
F
/R
G
for Inverting Operation
These basic relationships above are common to all traditional
operational amplifiers.
A1
IPN
IQ1
Q3
IPP
V
P
+
Q1
Q2
Z1
Q4
INP
IPN
A1
V
N
IR + IFC
IR IFC
IQ1
IE
AD8017
V
I
C
P
1
V
I
C
P
1
A2
C
P
2
ICQ + IO
V
O
9
A3
A2
C
D
Z1
ICQ IO
R
N
R
F
Z2
R
L
C
L
V
O
Z1 = R1 || C1
Z1
C
D
Figure 38. Simplified Block Diagram
AD8017
12
REV. A
APPLICATIONS
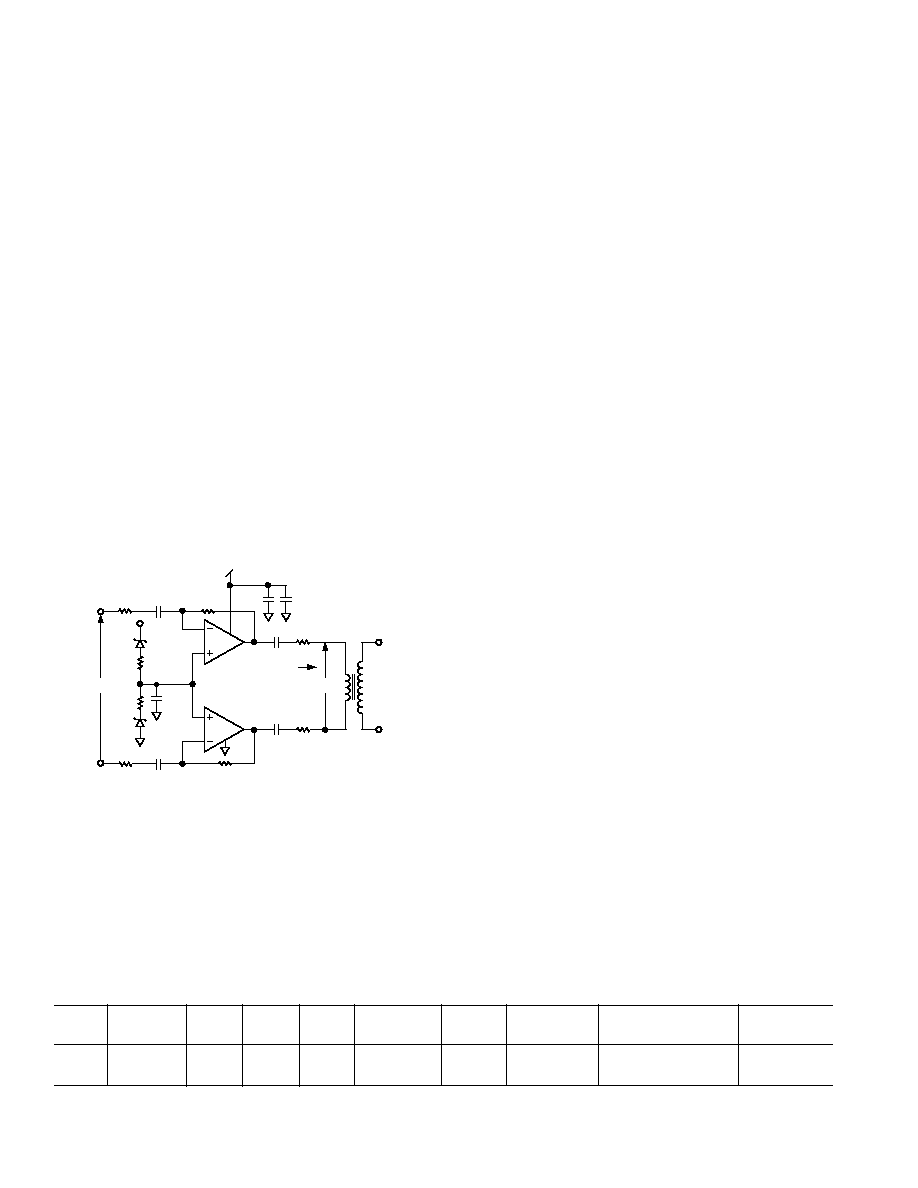
Output Power Characteristics as Applied to ADSL Signals
The AD8017 was designed to provide both relatively high cur-
rent and voltage output capability. Figures 17 and 20 quantify
the ac load current versus distortion of the device at loads of
100
and 25 at 1 MHz. Using approximately 50 dBc as the
worst case distortion limit, the AD8017 exhibits acceptable
linearity to within approximately 1.4 V of either supply rail (12 V
or
±6 V) while simultaneously providing 200 mA of load cur-
rent. These levels are achieved at only 7 mA of quiescent cur-
rent for each amplifier.
ADSL applications require signal line powers of 13 dBm that
can randomly peak to an instantaneous power (or V
× I product)
of 28.5 dBm. This equates to peak-to-rms voltage ratio of 5.3-
to-1. Using a 1:2 transformer in the ADSL circuit illustrated
below and 100
as the line resistance, a peak voltage of 4.2 V
at a peak current of 168 mA will be required from the line driver
output (see Table I). See detailed application below. A higher
turns ratio transformer can be used to reduce the primary out-
put voltage swing of the amplifier (for devices that do not have
the voltage swing, but do have the current drive capability).
However, this requires more than an equivalent increase in
current due to the added I
× R losses from the transformer for
the same receiver power. Generally this will result in added
distortion. Table I below shows the ADSL ac current and volt-
ages required for both a 1:1 and 1:2 transformer turns ratio.
V
IN
1k
1k
0.1 F
0.1 F
8
2
3
1
7
5
6
4.7V
4.7V
V
OUT
1:2
+12V
1k
0.1 F
169
169
4
1k
1 F
1 F
0.1 F
10 F
12.5
12.5
100
AD8017
50
EFFECTIVE
LOAD
Figure 39. Single +12 V Supply ADSL Remote Terminal
Transmitter
Table I. DSL Drive Amplifier Requirements for Various Combinations of Line Power, Line Impedance and Turn Ratios
Line
Insertion
Line
Turns
Crest
Reflected
Per Amp
Peak Per Amplifier Peak Current
Power
Loss
Load
Ratio
Factor
Impedance
R1 = R2
Voltage
Voltage Output
Output
13 dBm
1 dB
100
1:1
5.3
100
50
1.585 V rms
8.4 V peak
84 mA
13 dBm
1 dB
100
1:2
5.3
25
12.5
0.792 V rms
4.2 V peak
168 mA
Single +12 V Supply ADSL Remote Terminal (RT) Transmitter
For consumer use, it is desirable to create an ADSL modem
that can be a plug-in accessory for a PC. In such an application,
the circuit should dissipate a minimum of power, yet still meet
the ADSL specification.
The circuit in Figure 39 shows a single +12 V supply circuit
that uses the AD8017 as a remote terminal transmitter. This
supply voltage is readily available on the PCI connector of PCs.
The circuit configures each half of the AD8017 as an inverter
with a gain of about six. Both of the amplifier circuits are ac
coupled at both the inputs and the outputs. This makes the dc
levels of the circuit independent of the other dc levels of the
signal chain.
The inputs will generally be driven by the output of an active
filter, which has a low output impedance. Thus there will be a
minimum of loading of the source caused by the 169
input
impedance in the pass band. The output will require a 1:2 step-
up transformer to drive a 100
line. The reflected impedance
back to the primary will be 25
. With 25 of series termina-
tion added (12.5
in each output), the effective load that the
differential amplifier outputs will drive is 50
.
The input and output ac coupling provides two high pass cir-
cuits. The inputs are formed by the 0.1
µF capacitor and the
169
resistor, which provides a break frequency of about
9.4 kHz. The two 1
µF capacitors in the output along with the
50
effective load provides a 6.4 kHz break frequency in the
output side. Both of these circuits want to reject the Plain Old
Telephone System (POTS) band (dc to 4 kHz) while passing
the ADSL upstream band, which starts at about 20 kHz.
The positive inputs must be biased at mid supply, which is
nominally +6 V. This will maintain the maximum dynamic
range of the output in each direction, regardless of the tolerance
of the supply. The inverting configuration was chosen as this
requires a steady dc current from this supply, as opposed to the
signal-dependent current that would be required in a noninvert-
ing configuration. Several options were studied for creating this
supply.
A voltage regulator could be used, but there are several disad-
vantages. The first is that this will not track the middle of the
supplies as it will always have an output that is a fixed voltage
from ground. This also requires an additional active component
that will impact the cost of the total solution.
A two-resistor divider could also be used. There is a tradeoff
required here in the selection of the value of the resistors. As the
resistors become smaller, the amount of power that they will
dissipate will increase. For two 1 k
resistors, the power dissi-
pation in this circuit would be 72 mW. Thus, in order to keep
this power to a minimum, it is desirable to make the resistors as
large as possible.
AD8017
13
REV. A
The practical maximum value that these resistors can have is
determined by the offset voltage that is created by the input bias
current that flows through them. The maximum input bias
current into the + inputs is 45
µA. This will create an offset
voltage of 45 mV per 1 k
of bias resistor. Fortunately, the ac
coupling of the stages provides only unity gain for this dc offset
voltage, which is another advantage of this configuration. Any
dc offset in the output will limit the amount of dynamic signal
swing that will be available between the rails.
The circuit shown uses two 4.7 V Zener diodes that provide a
voltage drop which serves to limit the power dissipation in the
bias circuit. This allows the use of smaller value resistors in the
bias circuit. Thus, for this circuit the current will be (12 V
(2
× 4.7 V))/2 k = 1.3 mA. Thus, this circuit will dissipate
only 15.6 mW, yet only induce a maximum of 40 mV of offset
at the output. This circuit will also track the midpoint of the
supplies over their specified tolerance range.
The distortion of the circuit was measured with a 50
load.
The frequency used was 500 kHz, which is beyond the maxi-
mum required for the upstream signal. For ADSL over POTS, a
maximum frequency of 135 kHz is required. For ADSL over
ISDN, the maximum frequency is 276 kHz. The amplitude was
20 V p-p (10 V p-p for each amplifier), which is the maximum
crest signal that will be required. The second harmonic was
better than 80 dBc, while the third harmonic was 64 dBc.
This represents a worst case of the absolute maximum signal
that will be required for only a very small statistical basis and at
a frequency that is higher than the maximum required. For a
statistical majority of the time, the signal will be at a lower am-
plitude and frequency, where the distortion performance will be
better.
When the circuit was run while providing the upstream drive
signal in an ADSL system, the supply current to the part was
measured at 25 mA. Thus, the total power to the drive circuit
was 300 mW. This power winds up in three places: the drive
amplifier, down the line and in the termination and interface
circuitry.
The ADSL specification calls for 13 dBm or 20 mW into the
line. The line termination will consume an equal amount of
power, as it is the same resistance value. About a 1 dB loss can
be expected in the losses in the interface circuitry, which trans-
lates into about 10 mW of power. Thus, the total power dissi-
pated in the AD8017 when used as a driver in this application is
about 250 mW.
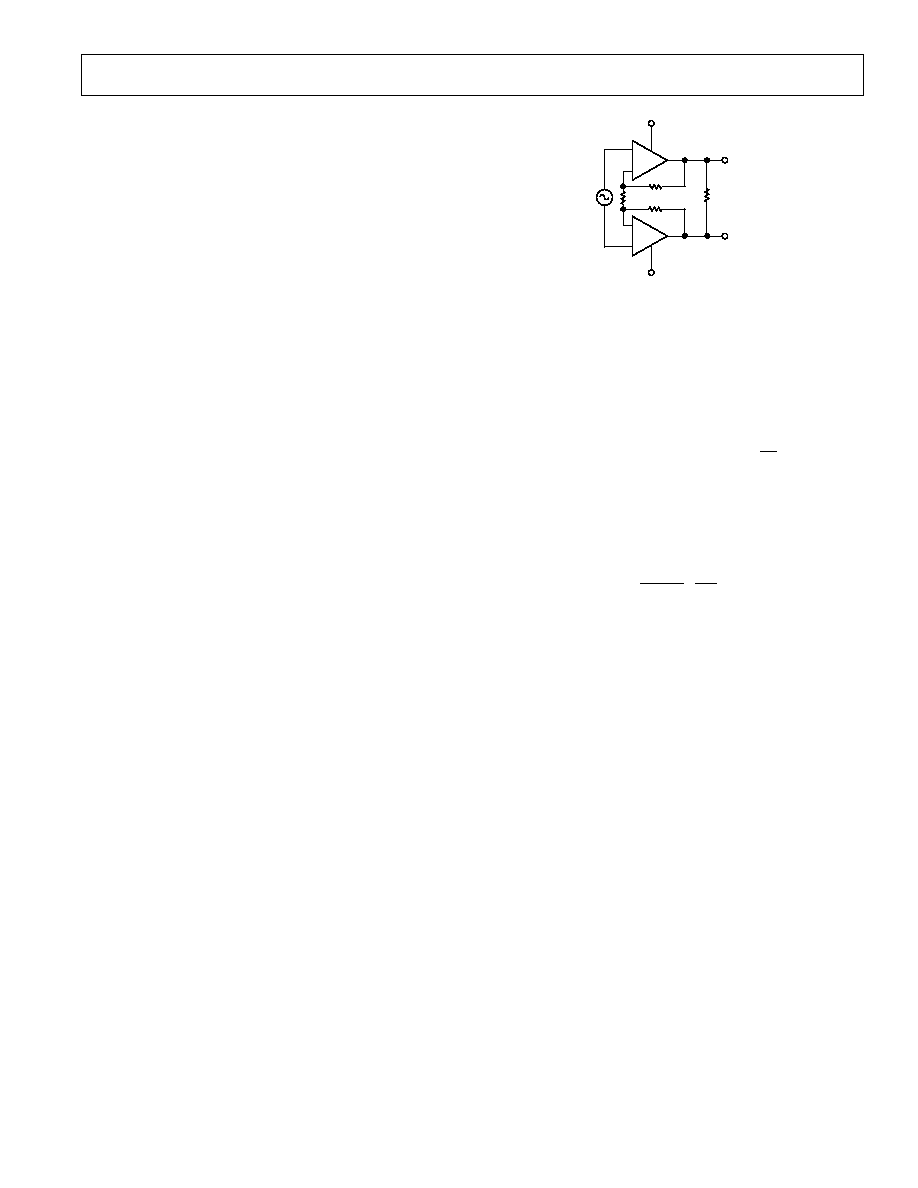
A1
A1
R
L
V
O1
V
O2
VCC
VEE
Figure 40. Differential Driver Simplified Circuit Schematic
It is important to consider the total power dissipation of the
AD8017 in order to properly size the heatsinking area for your
application. The dc power dissipation for V
IN
= 0 is simply,
I
Q
. (V
CC
+ V
EE
), or 2
× I
Q
× V
S
. For the AD8017, this number is
0.17 W. In this purely differential circuit we can use symmetry
to simplify the computation for a dc input signal,
P
I
V
V
V
V
R
D
Q
S
S
O
O
L
= ×
×
+ ×
(
)
×
2
4
This formula is slightly pessimistic due to the fact that some of
the quiescent supply current commutates during sourcing or
sinking current into the load. For a sine wave source, integra-
tion over a half cycle yields:
P
I
V
V V
R
V
R
D
Q
S
O
S
L
O
L
= ×
×
+ ×
-
2
2
4
2
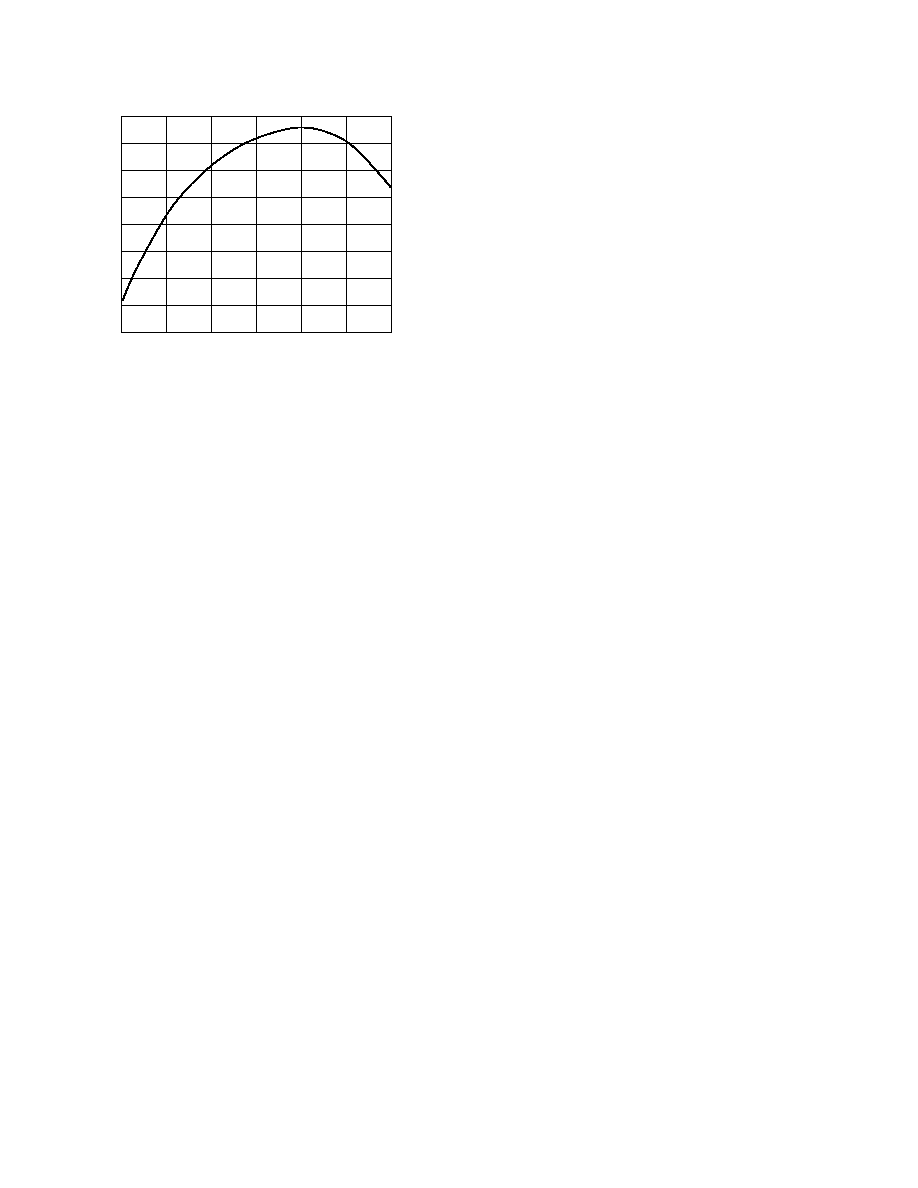
(Refer to Figure 41)
The situation is more complicated with a complex modulated
signal. In the case of a DMT signal, taking the equivalent sine
wave power overestimates the power dissipation by > 15%. For
example:
P
OUT
= 16 dBm = 40 mW
V
OUT
@ 50
= 1.41 V rms or V
O
= 1.0 V
at each amplifier output, which yields a P
D
of 0.436 W. By
actual measurement, P
D
for a DMT signal of 16 dBm requires
0.38 W of power to be dissipated by the AD8017.
AD8017
14
REV. A
OUTPUT VOLTAGE (V
O
) V
PK
POWER DISSIPATION (P
D
)
W
0.8
0
0.2
4
1
2
0
3
0.3
0.4
0.5
0.6
0.7
0.1
5
6
Figure 41. Power Dissipation (P
D
) vs. Output Voltage (V
O
),
R
L
= 50
Thermal Considerations
The AD8017 in a "Thermal Coastline" SO-8 package relies on
the device pins to assist in removing heat from the die at a faster
rate than that of conventional packages. The effect is to provide
a lower
JC
for the device. To make the most effective use of
this, special details should be worked into the copper traces of
the printed circuit board.
There will be a tradeoff, however, between designing a board
that will maximally remove heat, and one that will provide the
desired ac performance. This is the result of the additional para-
sitic capacitance on some of the pins that would be caused by
the addition of extra heatsinking copper traces.
The first technique for maximum heatsinking is to use a heavy
layer of copper. 2 oz. copper will provide better heatsinking than
1 oz. copper. Additional internal circuit layers can also be used
to more effectively remove heat, and to provide better power
and ground distribution.
There are no "ground" pins per se on the AD8017 (when run
on a dual supply), but the power supplies (Pins 4 and 8) are at
ac ground. Thus, these pins can be safely tied to a maximum
area of copper foil without affecting the ac performance of the
part. On the surface side of the board, the copper area that
connects to Pins 4 and 8 should be enlarged and spread out to
the maximum extent possible. As a practical matter, there will
be diminishing returns from adding copper more than a few
centimeters from the pins.
When the power supplies are run on the board on internal
power planes, then these should also be made as large as practi-
cal, and multiple vias (~0.012 in. or 0.3 mm) should be pro-
vided from the component layer near the power supply pins of
the AD8017 to the inner layers. These vias should not have any
of the traditional "thermal relief" spokes to the planes, because
the function of these is to impede heat flow for ease of soldering.
This is counter to the effect desired for heatsinking.
On the side of the board opposite the component, additional
heatsinking can be provided by adding copper area near the vias
to further lower the thermal resistance. Additional vias can be
provided throughout to better conduct heat from the inner
layers to the outer layers.
The remainder of the device pins are active signal pins and must
be treated a bit more carefully. Pins 2 and 6 are the summing
junctions of the op amps and will be the most adversely affected by
stray capacitance. For this reason, the copper area of these pins
should be minimized. In addition, the copper nearby on the
component layer should be kept more than 3 mm5 mm away
from these pins, where possible. The inner and opposite side
circuit layers directly below the summing junctions should also
be void of copper.
The positive inputs and outputs can withstand somewhat more
capacitance than the summing junctions without adversely af-
fecting ac performance. However, these pins should be treated
carefully, and the amount of heatsinking and excess capacitance
should be analyzed and adjusted depending on the application.
If maximum ac performance is desired and the power dissipa-
tion is not extreme, then the copper area connected to these
pins should be minimized. If the ac performance is not very
critical and maximum power must be dissipated, then the cop-
per area connected to these pins can be increased. As in many
other areas of analog design, the designer must use some judg-
ment based on the consideration of the above, in order to pro-
duce a satisfactory design.
AD8017
15
REV. A
LAYOUT CONSIDERATIONS
The specified high speed performance of the AD8017 requires
careful attention to board layout and component selection.
Table II shows recommended component values for the AD8017
and Figures 4244 show recommended layouts for the 8-lead
SOIC package for a positive gain. Proper RF design techniques
and low parasitic component selections are mandatory.
Table II. Typical Bandwidth vs. Gain Setting Resistors
(V
S
= 6 V, R
L
= 100 )
Small Signal
Gain
R
F
( )
R
G
( )
R
T
( )
3 dB BW (MHz)
1
619
619
54.5
110
+1
619
49.9
320
+2
619
619
49.9
160
+10
619
68.8
49.9
40
R
T
chosen for 50
characteristic input impedance.
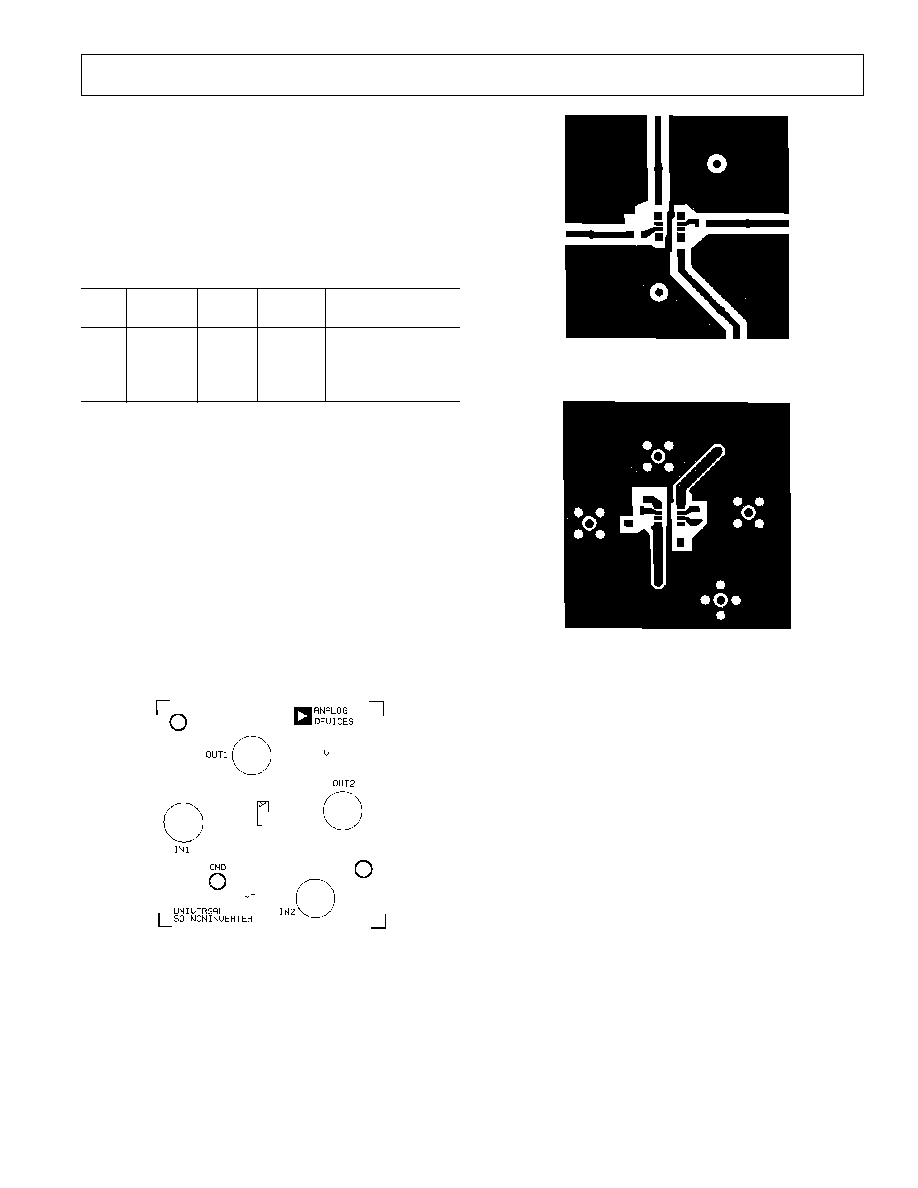
The PCB should have a ground plane covering all unused
portions of the component side of the board to provide a low
impedance ground path. The ground plane should be removed
from the area near the input pins to reduce stray capacitance.
Chip capacitors should be used for supply bypassing (see Fig-
ures 4 and 7). One end should be connected to the ground
plane and the other within 1/8 in. of each power pin. An addi-
tional (4.7
µF10 µF) tantalum electrolytic capacitor should be
connected in parallel.
The feedback resistor should be located close to the inverting
input pin in order to keep the stray capacitance at this node to
a minimum. Capacitance greater than 1.5 pF at the inverting
input will significantly affect high speed performance when
operating at low noninverting gain.
Figure 42. Universal SOIC Noninverter Top Silkscreen
Figure 43. Universal SOIC Noninverter Top
Figure 44. Universal SOIC Noninverter Bottom
AD8017
16
REV. A
OUTLINE DIMENSIONS
Dimensions shown in inches and (mm).
C342805/00 (rev. A) 01042
PRINTED IN U.S.A.
8-Lead SOIC
(SO-8)
0.1968 (5.00)
0.1890 (4.80)
8
5
4
1
0.2440 (6.20)
0.2284 (5.80)
PIN 1
0.1574 (4.00)
0.1497 (3.80)
0.0688 (1.75)
0.0532 (1.35)
SEATING
PLANE
0.0098 (0.25)
0.0040 (0.10)
0.0192 (0.49)
0.0138 (0.35)
0.0500
(1.27)
BSC
0.0098 (0.25)
0.0075 (0.19)
0.0500 (1.27)
0.0160 (0.41)
8
°
0
°
0.0196 (0.50)
0.0099 (0.25)
x 45
°